
Imagine the scent of old paper and the faint rustle as you unfold a map creased with journeys. A fingertip traces a coastline, follows a winding river, or pauses over a shaded patch of vibrant green marking a national forest. Maps ignite a sense of wonder and possibility; they connect our immediate surroundings to a vast, interconnected world. Today, maps do more than guide us—they are powerful tools at the forefront of safeguarding our planet.
Maps have evolved alongside our understanding of the environment, revealing the impact of human actions, illuminating conservation efforts, and empowering everyday citizens to contribute to a more sustainable future. As technology transforms cartography, maps become tools for forecasting change, helping us chart a course toward a healthier planet.
Mapmaking Through the Ages: A Brief History
Maps, in their myriad forms, have been companions to humankind for centuries. From the earliest navigational charts to meticulously crafted atlases, the desire to represent our world is deeply rooted in our shared history.
Early Maps
Early maps reflected the priorities of their creators. Ancient navigational charts highlighted coastlines and safe harbors, while maps for traders marked resource-rich areas. Ancient civilizations like the Babylonians created clay tablets depicting trade routes and agricultural lands. Nautical charts emphasized coastlines, harbors, and potential hazards – all features crucial for survival and exploration. While rudimentary, these maps reflected a profound, if localized, connection to the environment.

As civilizations advanced, so did their maps. Greek philosophers pondered the shape of the Earth, laying the foundation for more accurate geographical representations. Roman maps often included environmental notes, marking fertile areas, mountain ranges, or locations of valuable natural resources. By the Middle Ages, world maps, while still containing inaccuracies, illustrated an expanding knowledge of the Earth’s features, like continents, oceans, and major rivers.

Environmental Details Emerge
The 18th, 19th, and early 20th centuries witnessed a surge in scientific inquiry, leading to significant advancements in how environmental features were documented and represented on maps.
- Precision and Exploration: Improved surveying techniques and a growing understanding of scientific principles led to more detailed and accurate maps. Cartographers documented coastlines, mountain ranges, and major river systems, providing a more comprehensive picture of the Earth’s environmental diversity.
- Beyond Coastlines: Maps ventured beyond simply marking the locations of continents and oceans. Cartographers began incorporating details like vegetation patterns, soil types, and mineral deposits. This newfound focus on environmental features reflected the growing scientific interest in understanding the Earth’s ecosystems and resource distribution.
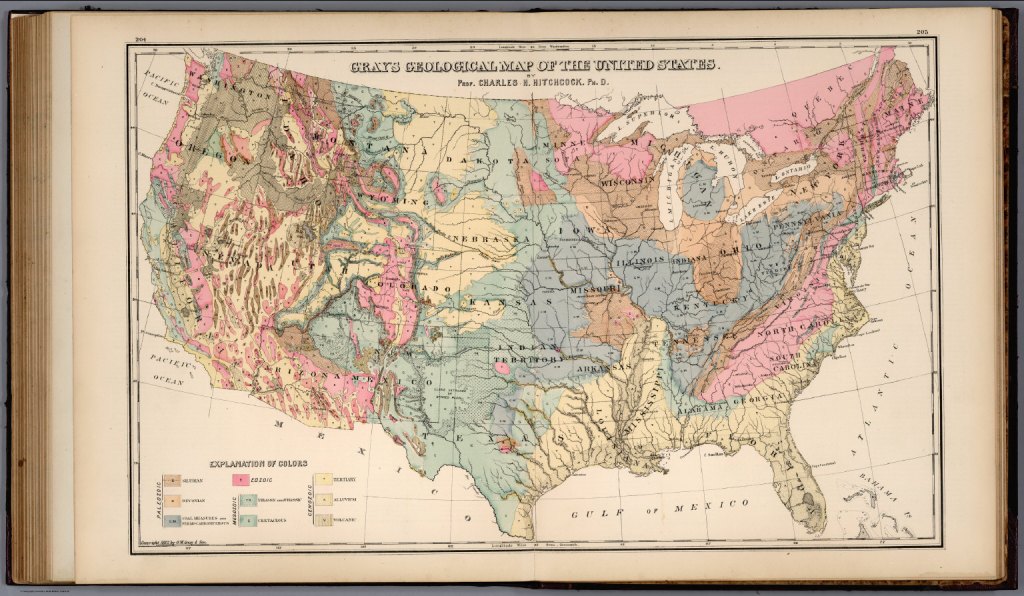
- The Birth of Thematic Maps: As scientific knowledge expanded, the need to visualize specific environmental data grew. Thematic maps emerged during this period, portraying a particular environmental theme across a geographic area. For instance, geological maps depicted rock formations and mineral resources, while vegetation maps highlighted the distribution of different plant communities. These thematic maps offered a valuable tool for scientists studying the natural world and resource managers making informed decisions.
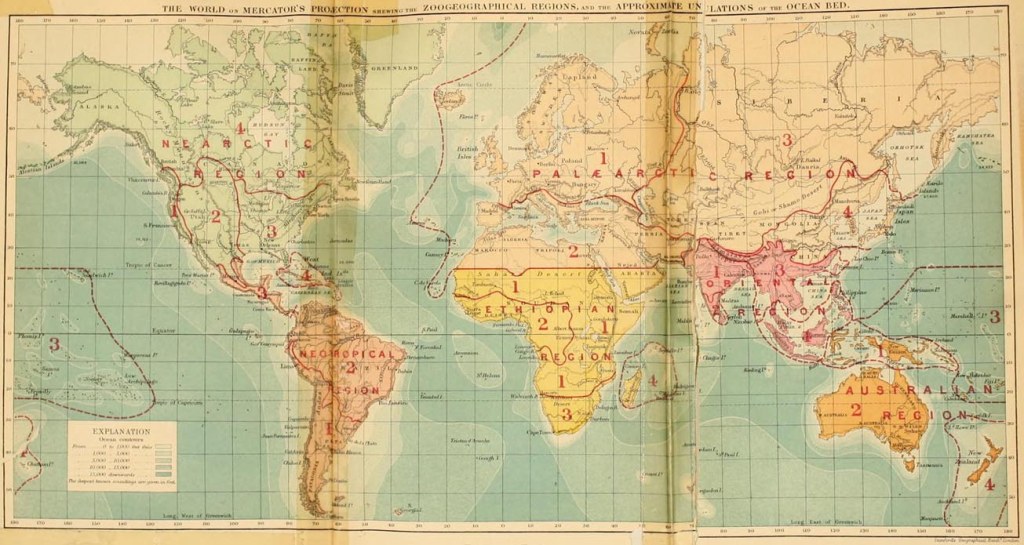
- Wallace’s Breakthrough: Mapping Biogeography: In 1876, naturalist Alfred Russel Wallace created a groundbreaking map that delineated six major biogeographic regions of the world based on distinctive distributions of animal species. Wallace’s map marked a significant milestone in environmental cartography, demonstrating the power of maps to visualize complex patterns in the natural world and advance scientific understanding.
This era witnessed the transformation of maps into more nuanced depictions of the Earth. Environmental themes took center stage, paving the way for today’s sophisticated applications of environmental cartography.
The Modern Mapping Revolution
The 20th and 21st centuries ushered in an era of unprecedented detail and sophistication in cartography, driven by breakthroughs in aerial photography, satellite imaging, and computer technology.
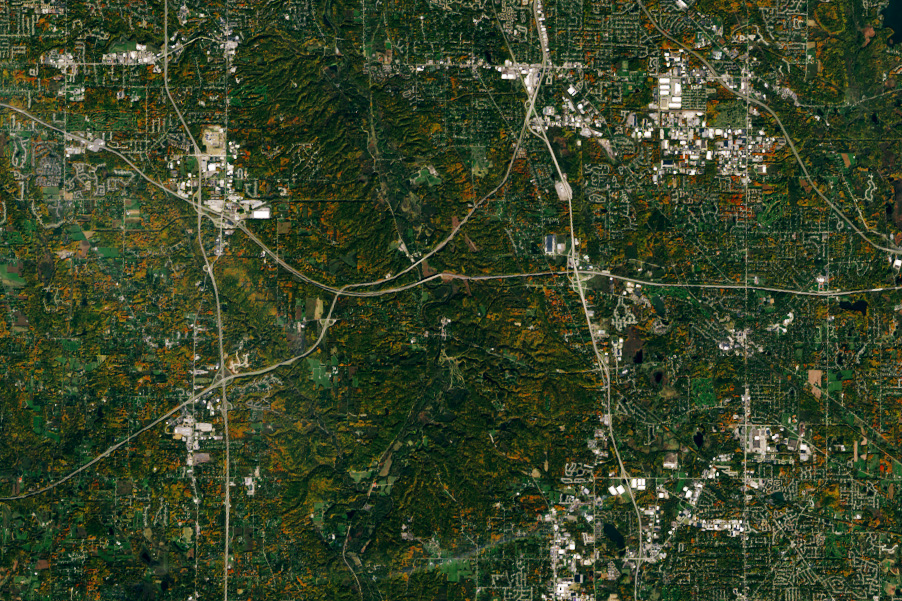
- The View from Above: Aerial Photography Transforms Maps: Initially used for military purposes, aerial photography offered a bird’s-eye view of vast landscapes that was unimaginable before. Cartographers could map intricate details of terrain, land use patterns, and environmental features with revolutionary precision.
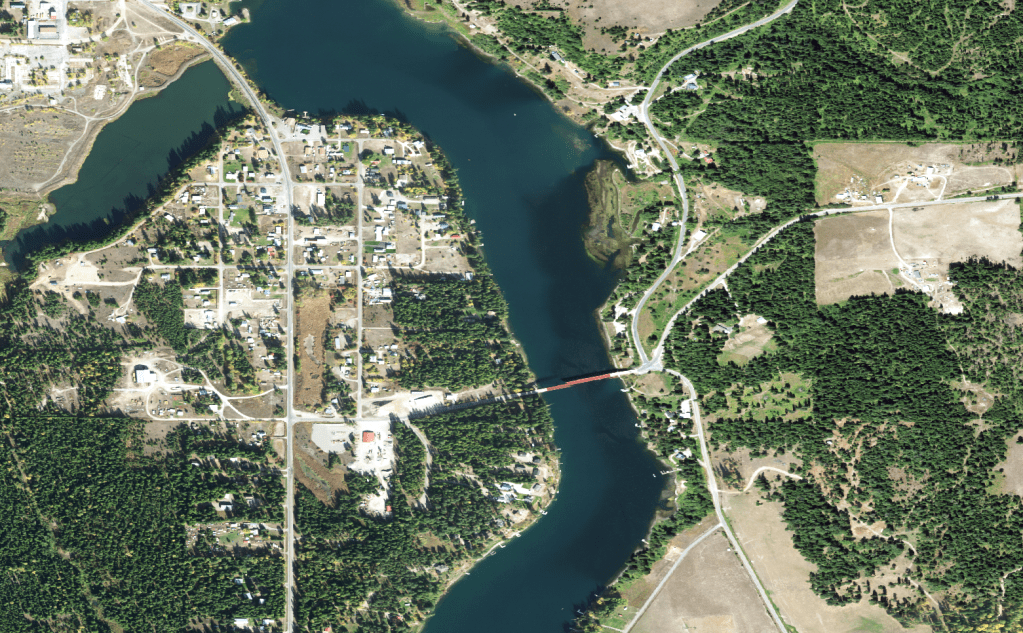
- A World in Pixels: The Satellite Revolution: The advent of satellite imagery placed the power to observe the Earth from space within our grasp. These images provided a continuous stream of data on land cover, climate patterns, and environmental change, enabling a global perspective on the planet’s interconnected systems.
- The Power of Data: Geographic Information Systems (GIS): The explosion of environmental data created by these technologies spurred the development of GIS. GIS allows for storing, analyzing, and visualizing vast geospatial datasets. This enables cartographers to create complex, multi-layered maps that reveal connections between the environment, human activities, and natural processes like never before.
This ongoing revolution has transformed maps into essential tools for monitoring, understanding, and making critical decisions about our dynamic world.
Using Maps to Safeguard the Environment
Environmental cartography goes beyond simply representing the Earth. It helps us understand the challenges our planet faces and guides us toward solutions.
Visualizing the Challenges Our Planet Faces
Maps possess a unique power to make complex environmental problems starkly visible, transforming abstract data into compelling visual narratives that demand action.
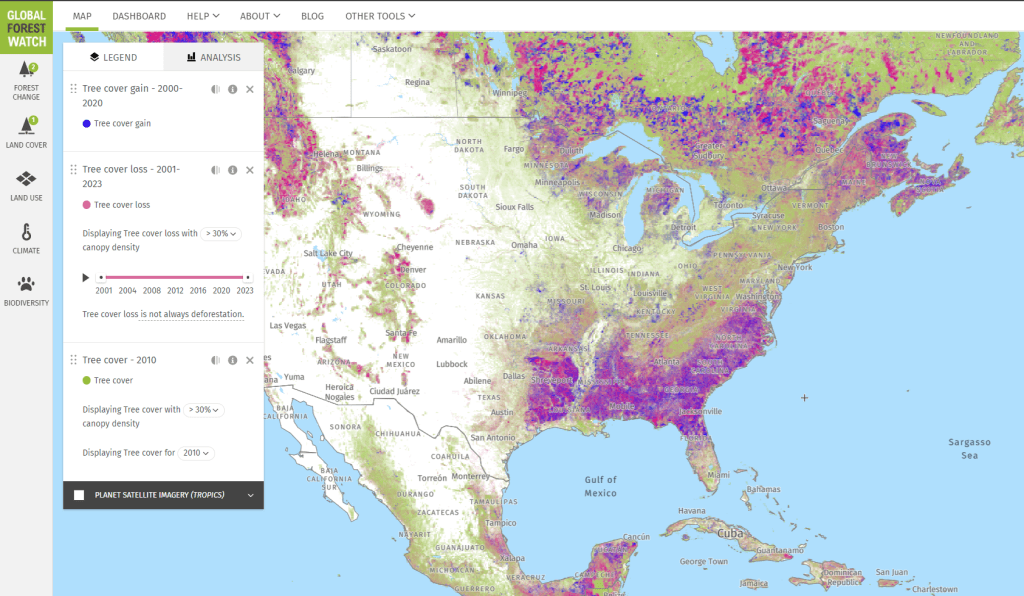
- Confronting Deforestation: Time-lapse maps comparing lush forests to barren landscapes expose the devastating pace of deforestation. They illustrate the loss of biodiversity hotspots and the critical role of forests in regulating the climate. Global Forest Watch (GFW) is a free, online platform that provides near real-time data on forest changes around the world. It empowers governments, businesses, researchers, and the public to track deforestation, fires, and other forest threats, enabling informed action to protect our forests.
- Pollution Unveiled: Maps can expose the invisible threat of pollution. Air quality maps, like those found on AirNow.gov, pinpoint hotspots where toxic particles threaten human health. Meanwhile, maps depicting ocean currents can reveal the alarming spread of pollutants like microplastics across vast distances.
- The Changing Climate: Maps are essential tools in documenting the impacts of climate change. Temperature anomaly maps showcase warming trends beyond the norm. In contrast, maps highlighting melting glaciers, sea-level rise, and shifting rainfall patterns illustrate our changing climate’s global and local impacts. Websites like the Climate Impact Lab Map allow users to explore highly localized projections of future climate impacts, bringing the consequences of climate change closer to home.
- Maps for Advocacy: EJSCREEN, the EPA’s Environmental Justice Screening and Mapping Tool, transforms environmental data, such as pollution levels and proximity to hazardous sites, and demographic data, like race and income, into stark visualizations. These are not simply depictions of problems but powerful tools for advocacy. Environmental justice groups and concerned citizens use these maps to highlight disproportionate environmental burdens, inform policy decisions, and drive action toward a more equitable and healthy planet.
By transforming data into compelling visuals, maps offer a visceral understanding of the urgency and scale of our environmental challenges.
Charting a Path to Conservation
Maps are no longer passive representations of the Earth; they are vital tools to guide conservation efforts and protect our planet’s precious ecosystems. Here’s how:
- Identifying Critical Habitats: The U.S. Fish and Wildlife Service (FWS) Critical Habitat Portal provides detailed maps pinpointing areas designated as vital for endangered or threatened species. These maps reveal essential characteristics like nesting grounds for migratory birds, spawning areas for fish, or critical wintering habitats for large mammals. This information, available on the FWS website, guides the designation of protected areas and ensures these crucial spaces are safeguarded. Similar mapping resources may also be available through state wildlife agencies and conservation organizations.
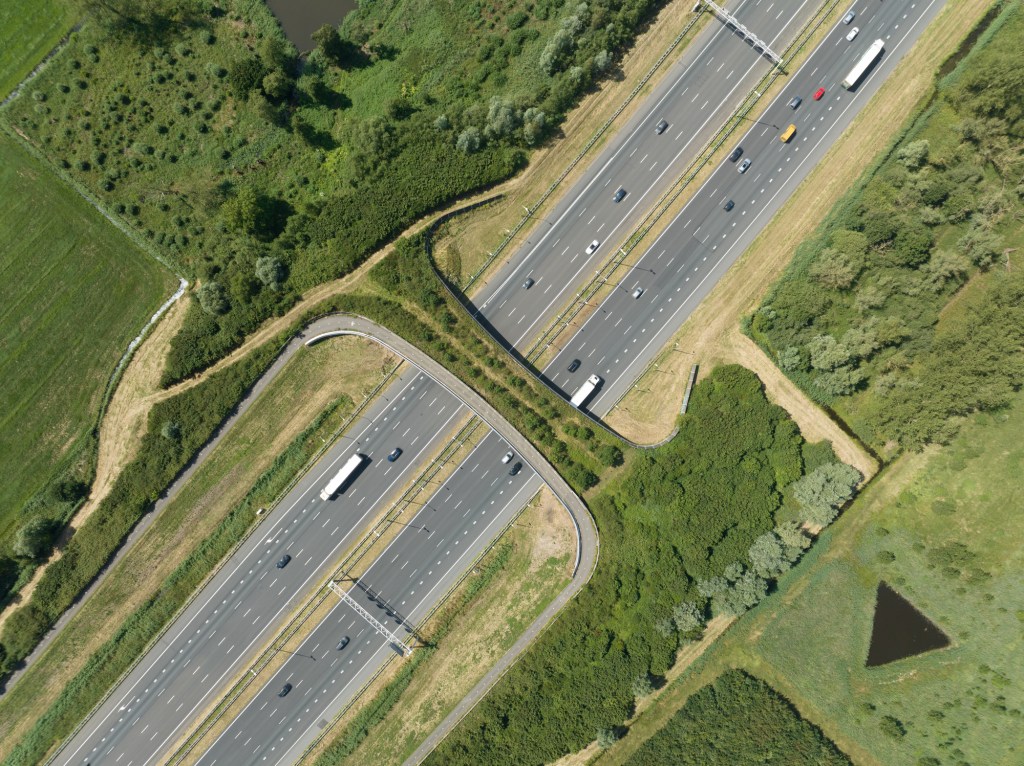
- Designing Wildlife Corridors: Habitat fragmentation due to human activity is a major threat to wildlife populations. Mapping tools, like the Western Migrations Initiative Wildlife Corridors And Route Viewer, offer critical insights. These tools visualize wildlife movement patterns, identify fragmented habitats, and model potential wildlife corridors, allowing animals to move safely between isolated areas. For example, projects in the Rocky Mountains pinpoint crucial pathways for migrating elk herds. This data helps guide the construction of wildlife crossings under highways or the conservation of natural corridors between protected areas. Similar mapping initiatives exist worldwide, aiding in the protection of diverse wildlife populations.
- Monitoring Threats and Prioritizing Efforts: Maps help visualize conservation challenges, allowing organizations to prioritize interventions and allocate resources effectively. For instance, EDDMapS provides real-time data on invasive species spread across North America. Users can report sightings, track invasions, and receive alerts for emerging threats in their area. Similar mapping platforms exist for monitoring other threats like deforestation or poaching activity, empowering conservationists with crucial data for targeted action.
- Restoring Ecosystems: Maps are vital tools in the restoration of ecosystems. They can reveal the original extent and characteristics of habitats before degradation, guiding efforts to re-establish natural conditions. Maps also help track the progress of restoration projects, such as reforestation or wetland restoration, by monitoring changes in vegetation, land cover, and overall ecological health over time. This data allows for adaptive management and ensures restoration projects are on the right trajectory towards success. The North American Environmental Atlas, created by the Commission for Environmental Cooperation (CEC), provides a wealth of data relevant to restoration efforts. This includes maps of land cover change, watersheds, protected areas, and other environmental features across the continent, facilitating informed decision-making at regional and local scales.
By providing accurate and visually compelling data, maps empower conservationists to make informed decisions, optimize strategies, and track progress toward a more sustainable future.
Mapping Our Changing Planet: Monitoring Environmental Transformations
Maps provide more than a static snapshot of our world – they can reveal the dynamic forces shaping our planet over time. From shifting coastlines to long-term changes in land cover, maps offer a unique window into the environmental transformations underway.
- Documenting Urban Sprawl: Urbanization is one of the most significant ways humans transform the landscape. The Atlas of Urban Expansion provides a powerful tool for visualizing the relentless expansion of cities. Its time-series maps spanning decades highlight the conversion of natural lands into developed areas. This information can help policymakers make informed decisions about urban planning, infrastructure development, and the preservation of green spaces.

- Tracking the Retreat of Glaciers: Glaciers are sensitive indicators of climate change. The World Glacier Monitoring Service (WGMS) collects and compiles standardized data on glacier changes worldwide. Their Fluctuations of Glaciers Browser allows users to explore maps comparing glacial extent over time, offering a stark visual record of the impact of rising temperatures. This visual evidence underscores the urgency of addressing climate change and highlights the regions most vulnerable to its effects.
- Coastal Erosion: Maps are vital in monitoring coastal erosion, accelerated by rising sea levels and extreme weather events. The USGS Coastal Change Hazards Portal provides a wealth of maps and data on this issue. Historical maps juxtaposed with current ones can pinpoint areas experiencing the most dramatic coastline changes. This data is essential for coastal communities to make informed decisions about infrastructure protection, land use planning, and adaptation strategies.
Maps go beyond documenting change. They are powerful tools for long-term monitoring and forecasting. By comparing past patterns with current data, scientists can model future trends, allowing communities to proactively plan and build resilience in the face of environmental transformations.
Maps for Impact: Driving Informed Decision-Making
From the earliest navigational charts guiding explorers across vast oceans to sophisticated digital models charting our planet’s future, maps hold a unique power. Environmental cartography offers more than a view of the world – it provides a blueprint for its protection. Maps help us understand the delicate interconnectedness of our planet and serve as powerful tools for driving informed decision-making.
Let’s harness the power of maps by advocating for their use in shaping environmental policies. By contacting our local representatives and expressing support for map-informed decision-making, we can ensure that the best available data and scientific understanding guide actions that shape the future of our planet. Whether it’s combating climate change, protecting precious ecosystems, or building sustainable cities, maps light the path toward informed choices that will safeguard the Earth for generations to come.

Leave a comment