
The relentless advance of climate change is no longer an abstract threat discussed in scientific reports. It’s the extra surge of water pushing further inland during storms, the quiet creep of the tide eroding familiar shorelines, and the unsettling question of what familiar places might disappear beneath the waves. Coastlines around the world are experiencing the impacts right now, with rising seas inundating communities and transforming landscapes.
Geographic Information Systems (GIS), with their capacity to visualize complex data, provide a stark view of what the future may hold for coastal regions. This technology is more than just maps – it helps us see what is and what could be. This ability to illustrate potential consequences makes GIS an invaluable tool in understanding the challenges of climate change and planning for the future.
GIS: A Powerful Tool for Climate Understanding
While it’s essential to comprehend the global scale of climate change, localized analysis is crucial for effective action. Sea level rise projections can vary significantly due to factors like coastal terrain and regional ocean currents. This article leverages the power of GIS to analyze potential sea level rise scenarios specifically along the East Coast of the United States, focusing on the area around Virginia Beach.
But what exactly is GIS? Geographic Information Systems go far beyond simple maps. Here’s a closer look:
- Data is Key: The foundation of GIS is information linked to specific locations. This can range from elevation points to the boundaries of wetlands to the footprint of buildings within a town.
- Layers on Layers: GIS organizes data into layers like transparent sheets on a projector. You might have a base layer representing topography, another layer showing infrastructure, and even a layer highlighting population density.
- Analysis Power: GIS lets us explore relationships between these layers. For example, we can identify areas below a certain elevation, see which roads and neighborhoods these areas include, and provide the number of impacted residents.
- Visual Answers: The results of GIS analysis can be presented as maps, charts, or interactive tools. This visualization makes complex scenarios easier to grasp, aiding decision-makers.
GIS allows us to combine precise terrain models with projected sea level increases in the context of sea level rise. The resulting visuals starkly illustrate the areas facing inundation, empowering communities and policymakers to plan for the future.
Understanding the GIS Foundations
Visualizing potential sea level rise scenarios with GIS requires carefully selected datasets and a clear understanding of how they come together within the analysis. Let’s take a closer look at the essential components:
Elevation Data: Building the Groundwork
Digital Elevation Models (DEMs) and high-resolution LiDAR datasets create a 3D representation of the Earth’s surface. Every point on these models has a known elevation above sea level. Think of these as extremely detailed topographic maps, where even subtle variations in terrain are recorded. This detail is essential, especially in urban areas, as even small changes in elevation can influence the extent of potential flooding.
GIS Software: The Toolbox
GIS software like ArcGIS Pro or QGIS provides the environment to combine the elevation data with different sea level rise scenarios. It allows us to calculate which areas fall below a certain inundation level, visualize the results, and create maps that clearly depict potential impacts.
Land Cover: Revealing Impact Patterns
Land cover data adds another layer to the analysis. Maps showing the distribution of forests, wetlands, urban areas, etc., help us understand how different land types will be affected by sea level rise. For example, this data can highlight the potential loss of protective coastal wetlands or the extent of flooding in heavily developed areas.
Sea Level Rise Projections: Exploring Possible Futures
The National Oceanic and Atmospheric Administration (NOAA) Sea Level Rise Viewer is a go-to resource. They integrate complex scientific models considering global and regional factors influencing sea levels. These models offer different scenarios (e.g., low, medium, high) based on varying greenhouse gas emissions and climate change levels. Analyzing multiple scenarios gives us a better sense of potential risk ranges.

Case Studies: Seeing the Impacts
GIS mapping brings the potential consequences of sea level rise into startling focus. It moves the discussion away from abstract numbers and shows how familiar landscapes can be transformed. To understand the localized risk along the East Coast, let’s examine several vulnerable locations in detail:
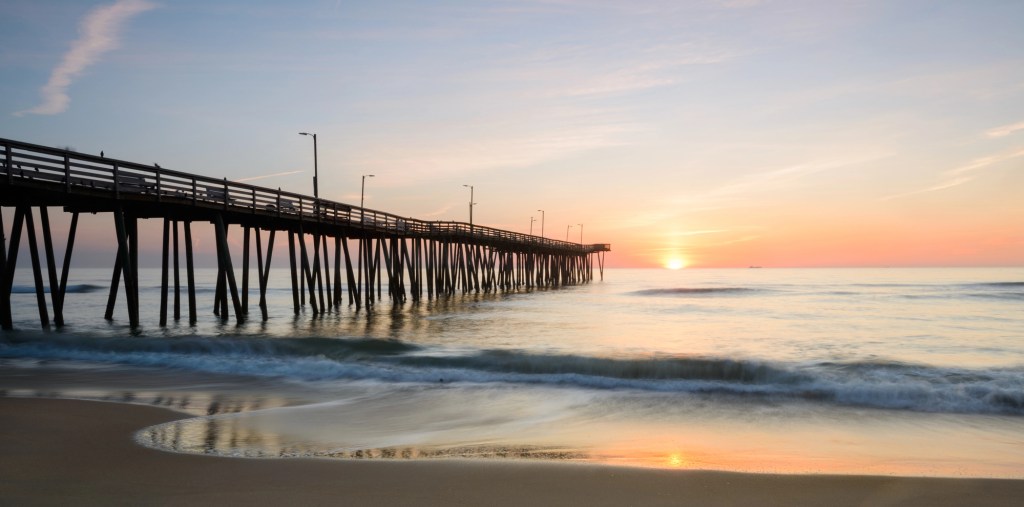
Virginia Beach Oceanfront
Virginia Beach, a popular tourist destination with a vibrant oceanfront, faces a complex challenge from rising sea levels. While the animation you’ll see depicts potential inundation across the entire beachfront area, it’s important to understand why bays, rivers, and other connected waterways may experience even more significant rise and inland flooding.

Why Bays and Rivers See Greater Rise
While the entire ocean rises with sea level change, some areas experience a magnified effect. This is due to a phenomenon called coastal squeeze. As sea levels rise, bays and rivers essentially have nowhere to go. Their waters get pushed landward, causing inundation further inland compared to the oceanfront itself.
Imagine a rising tide filling a bathtub. The water level rises uniformly, but if there’s a small inlet or channel leading to a lower area (like a built-in soap dish), the water in that confined space will rise even higher as it’s forced inwards.
Impacts on Virginia Beach
While beachfront inundation might be an initial concern, sea level rise impacts Virginia Beach in several ways:
- Beach Erosion: Although the animation might show some inundation on the beachfront, the primary concern for Virginia Beach may be increased erosion. As sea levels rise, waves carry more energy and attack the shoreline with greater force, leading to a retreat of the beach itself.
- Flooding in Low-Lying Areas: Even with a seemingly modest rise in sea level, areas near the oceanfront with lower elevations, like canals or around storm drains, will experience more frequent flooding during high tides and storm surges.
- Saltwater Intrusion: Rising sea levels can cause saltwater to push further upstream into rivers and groundwater sources. This saltwater intrusion can contaminate freshwater supplies, impacting drinking water, agriculture, and ecosystems that rely on freshwater.
These impacts will pose both immediate challenges and require long-term planning to protect the city’s natural resources, infrastructure, and thriving tourism industry.
Planning for the Future
The City of Virginia Beach has proactively addressed sea level rise through its Sea Level Wise program. This initiative involves detailed studies, community engagement, and the creation of an adaptation strategy to protect the city’s infrastructure, economy, and natural environment from rising sea levels. This is especially important given the large number of waterways in the area, including the Lynnhaven and Elizabeth Rivers.
Lynnhaven River
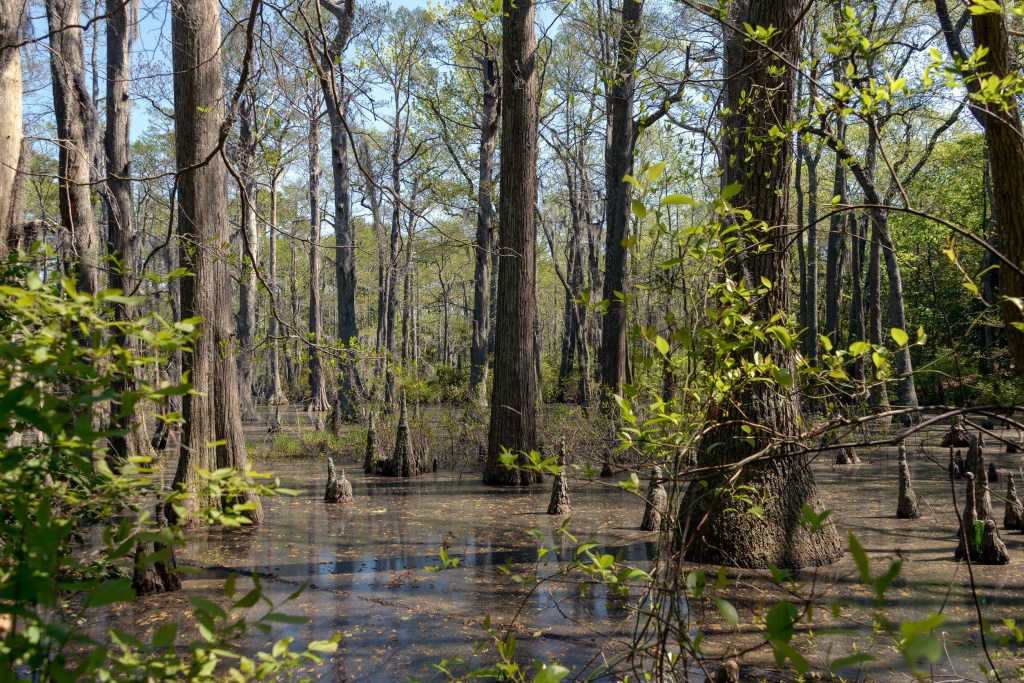
The Lynnhaven River is a tidal estuary that flows into the southern part of Chesapeake Bay. This unique ecosystem is home to diverse wildlife, including a famous oyster population. However, the river’s low-lying shoreline and connection to the broader Chesapeake Bay system make it especially vulnerable to sea level rise.

Coastal Squeeze in Action
Sea level rise data suggests significant flooding potential on the land areas flanking both sides of the Lynnhaven River’s mouth. These include the neighborhoods of Little Neck and Bay Colony on the eastern side and Chic’s Beach and Cape Henry on the western side. This pattern highlights the coastal squeeze phenomenon. As sea levels rise, the waters of the Lynnhaven encounter a bottleneck where the river meets the bay. This pushes water further inland, flooding areas that may be seemingly distant from the main watercourse.
Flooding in the ‘Branches’
The Lynnhaven River system includes several branches, creeks, and inlets winding inland. These branches are particularly susceptible to inundation, even more so than the broader river area. They act like smaller, narrower “bathtubs” connected to the larger Lynnhaven system. As the overall water level rises, this pushes water further into the branches, impacting shorelines further from the main river channel.
Compounding Factors
It’s important to remember that sea level rise doesn’t occur in isolation. Storms, heavy rainfall, and land subsidence (sinking) can exacerbate the impacts of sea level rise in the Lynnhaven area. Existing development patterns and infrastructure along the shoreline also play a role in the area’s overall vulnerability.
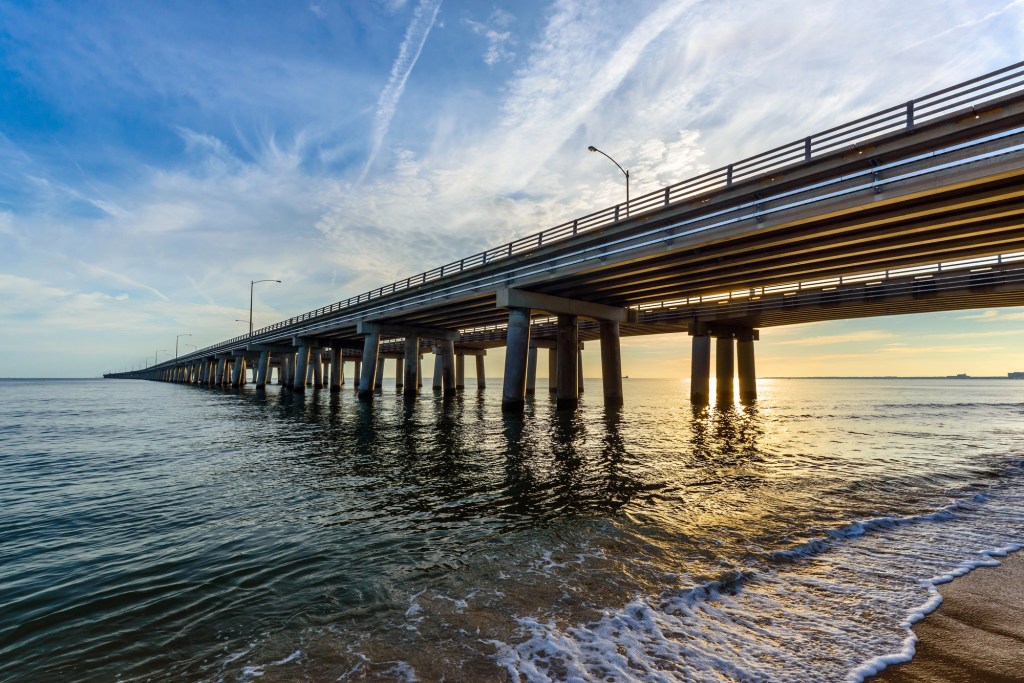
Elizabeth River (Virginia Beach)
While it might not be directly on the coastline, a section of the Elizabeth River flows through Virginia Beach, making this area also susceptible to the impacts of sea level rise. The Elizabeth River is a complex tidal waterway with significant shipping activity. It connects to the James River and ultimately flows into the southern Chesapeake Bay, opening to the Atlantic Ocean.

Indirect Ocean Connection, Magnified Impacts
Even though the Elizabeth River in Virginia Beach isn’t directly on the oceanfront, its connection to the Chesapeake Bay creates a pathway for sea level rise to impact the area. Think of it like a chain reaction: water rising in the ocean pushes into the Chesapeake Bay, which in turn raises water levels in connected waterways like the Elizabeth River.
Dense Development Increases Risk
The Virginia Beach portion of the Elizabeth River is characterized by high development. Unlike some areas of the Lynnhaven, where wetlands and natural buffers exist, neighborhoods along the Elizabeth often extend right to the river’s edge. This combination of shoreline development and low-lying terrain makes the area particularly vulnerable to flooding. Sea level rise projections show significant potential inundation in these densely populated neighborhoods, even with relatively moderate increases in sea level.
Informing Policy and Planning
GIS-produced visualizations of sea level rise are more than stark illustrations of a potential future. They are indispensable tools to guide policy decisions and proactive planning measures to safeguard coastal communities. Let’s delve deeper into how GIS analysis supports responsible decision-making.
Infrastructure Protection: Identifying Risks and Prioritizing Investments
Sea level rise scenarios visualized with GIS can be overlaid with the location of critical infrastructure like roads, bridges, power plants, and wastewater treatment facilities. This analysis helps pinpoint assets most at risk under different sea level rise projections. Armed with this data, planners can prioritize reinforcement efforts for vulnerable infrastructure. Relocation of essential infrastructure to higher ground or rerouting roads to maintain connectivity during flood events may also be considered based on the analysis.
Development Planning: Guiding Growth in Safer Areas
GIS allows planners to factor sea level rise into zoning decisions and land-use regulations. Visualizations of potential inundation zones can guide the restriction of new development in high-risk areas. By proactively directing growth towards areas on higher ground, communities can avert both potential property damage and the need for costly infrastructure protection measures in the future.
Disaster Preparedness: Planning for Effective Response
GIS analysis plays a crucial role in disaster preparedness. Planners can determine if existing evacuation routes might become unusable under certain scenarios by identifying areas most likely to require evacuation during storms and flooding events caused by sea level rise. This foresight supports the creation of alternative routes, staging areas for resources, and the pre-identification of shelters in safe locations.
Building Coastal Resilience: Data-Driven Solutions
GIS is a powerful tool to evaluate the effectiveness of potential adaptation strategies such as natural defenses and engineered solutions. Analysis can show where restoration of wetlands or dunes could provide protective buffers against rising sea levels. Seawalls and other hard structures can be modeled within the GIS environment to visualize their impact on the coastline and potential effects on neighboring areas. By analyzing the interplay between natural and built solutions within a specific coastal environment, GIS aids in finding the approach, or combination of approaches, that offer the most robust and sustainable coastal protection.
Protecting Our Coasts
GIS technology gives us a window into the potential consequences of sea level rise. The maps and visualizations make the challenge impossible to ignore, highlighting the urgent need to both address the root causes of climate change and to invest in proactive measures to protect our coastal communities.
This isn’t a challenge solely for policymakers and scientists. Informed citizens are key to making the necessary changes. Explore tools like the NOAA Sea Level Rise Viewer to see how your own community may be affected. Support policies that promote climate mitigation, the development of sustainable coastal infrastructure, and the protection of vulnerable natural areas. From individual choices to collective action, everyone has a role to play in building a more resilient future for our coasts.

Leave a comment